About

Data Center Expert is a software tool used to monitor critical devices like RPDUs, PDUs, etc. In my experience, as with any product there is not always a one-size-fits all solution. Schneider Electric does a great job with their Data Center Expert product, however there are gaps that need to be filled here and there for example Mass Configuration and in this case managing and monitoring multiple Data Center Expert servers.

As a service / tool owner. We needed the ability to quickly view the status and key information points of all Data Center Expert servers globally. Prior to this development, it took roughly 15-20 minutes to manually collect and record all this information for each server daily. This activity would take between 2.25hrs and 3hrs by engineers who were responsible for said server in their respective physical locations. It was obviously a great candidate for automation/integration development.

My approach to this problem:
  1. Utilize existing tools where possible.
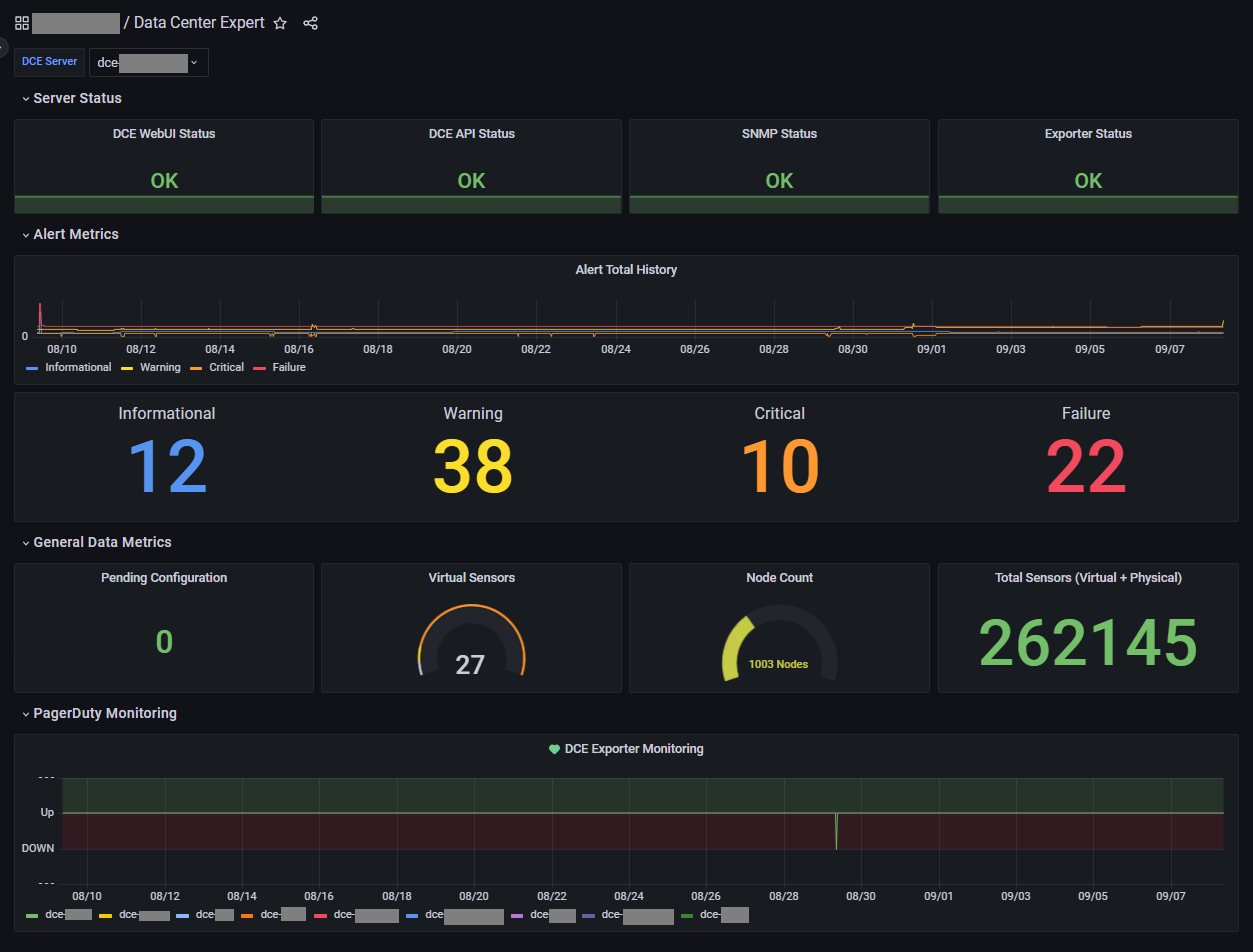
    • Prometheus Blackbox and SNMP Exporters used to collect information on the WebUI, API and the OS.
    • Grafana was used for visualizations as it was already widely used by the team.
    • PagerDuty used to generate alerts if an issue is detected.
  2. Create a scalable and reusable process as the team has only grown the Data Center Expert environment.
  3. Develop a custom Data Center Expert Exporter for Prometheus.
    • Collect key datapoints from the Data Center Expert software via the built-in SOAP API integrations.
    • Provide data in line with the Prometheus' documentation for writing exporters.
    • Collect data every 5 minutes vs once every day.
Results:
Automating this process resulted in the reduction of manual labor spent on these repeated processes by 100% as it is now fully automated with data being stored in Prometheus at a much higher frequency. The company stands to save approximately 780 hours annually as a consequence of this optimization. To contextualize this achievement further, considering 260 workdays per year and an hourly rate of $40.00 for an IT Engineer tasked with performing this activity daily, the cost savings amount to $31,200 annually.

Grafana / Data Center Expert

Hover over or click the + icons for additional information about each item

Server Selection

Dropdown enables easy selection of which server to observe.

WebUI Status

Using the Prometheus Blackbox Exporter. The web front-end of the server is being monitored for accessibility.

API Status

Using the Prometheus Blackbox Exporter. The servers SOAP API is being monitored for accessibility and functionality.

SNMP Exporter Status

Using the Prometheus SNMP Exporter. The servers SNMP Port and Data is monitored for accessibility and functionality.

DCE Exporter Status

The custom developed DCE Exporter Service is monitored on the tools server to ensure that it is running and running properly.

Alert Metrics by Type

A timeline allows to view the alerts, by type, as they occurred over time.

Alert Types

View the count of alerts by type allow for fast and easy evaluation of the DCE Monitoring Server / Environment.

Pending Configurations

Provides visibility into how many devices need to be configured.

Virtual Sensors

The DCE Tool has a method to manufacture your own sensors based on calculations or consolidations of metrics within the tool. These are called Virtual Sensors. Virtual Sensors create load and impact the system if too many are created. This provides insight into that number.

Node Count

Data Center Expert has a node / endpoint count limitation of 3000 with a recommendation to stay under 2500 to maintain application performance. This metric allows for the team to make plans as we come close to those limitations to stand up another instance.

Total Sensors

This is a total of all sensors for all devices that are being monitored. The higher the number of sensors the more impact it has on the system.

Exporter Monitoring

Grafana is monitoring the service and creates PagerDuty Alerts if an issue is detected.
  • Server Selection

    Dropdown enables easy selection of which server to observe.
  • WebUI Status

    Using the Prometheus Blackbox Exporter. The web front-end of the server is being monitored for accessibility.
  • API Status

    Using the Prometheus Blackbox Exporter. The servers SOAP API is being monitored for accessibility and functionality.
  • SNMP Exporter Status

    Using the Prometheus SNMP Exporter. The servers SNMP Port and Data is monitored for accessibility and functionality.
  • DCE Exporter Status

    The custom developed DCE Exporter Service is monitored on the tools server to ensure that it is running and running properly.
  • Alert Metrics by Type

    A timeline allows to view the alerts, by type, as they occurred over time.
  • Alert Types

    View the count of alerts by type allow for fast and easy evaluation of the DCE Monitoring Server / Environment.
  • Pending Configurations

    Provides visibility into how many devices need to be configured.
  • Virtual Sensors

    The DCE Tool has a method to manufacture your own sensors based on calculations or consolidations of metrics within the tool. These are called Virtual Sensors. Virtual Sensors create load and impact the system if too many are created. This provides insight into that number.
  • Node Count

    Data Center Expert has a node / endpoint count limitation of 3000 with a recommendation to stay under 2500 to maintain application performance. This metric allows for the team to make plans as we come close to those limitations to stand up another instance.
  • Total Sensors

    This is a total of all sensors for all devices that are being monitored. The higher the number of sensors the more impact it has on the system.
  • Exporter Monitoring

    Grafana is monitoring the service and creates PagerDuty Alerts if an issue is detected.