About
This project started as a means to collect server power utilization for use by data center engineers, planners and designers to enable data driven decisions as it relates to deciding which make, model and configurations (CPU / Memory / GPU) to purchase as well as how to design, build, upgrade the data center and data center supporting infrastructure. As someone who would plan new installs, I needed to fully understand how much power a given system was capable of consuming in real life situations such as grid computing, general computing and virtualization.Think of this as "a product for data center professionals by a data center professional".
Over time this project has turned into an officially supported "program" where we regularly test and evaluate servers before purchase using demo units consisting of current and next generation gear to develop power utilization profiles. The data, and its visualizations are now consumed at all levels of the data center and server management teams between engineers, managers and senior directors.
How it works:
We meet regularly with our server OEMs (HPE, Supermicro, Dell, Lenovo). New technologies and developments are a part of the discussions. This is where we decide on which gear we would like to evaluate before purchase.
- Evaluation servers are installed in racks dedicated to testing and evaluations and segregated from the production environment.
- Devices are brought online, and the baseline configurations are made in the onboard management (ILO, IDRAC, RIB, XCC, BMC). IPMI being one key piece that is configured.
- Devices are brought into Prometheus using the IPMI Exporter.
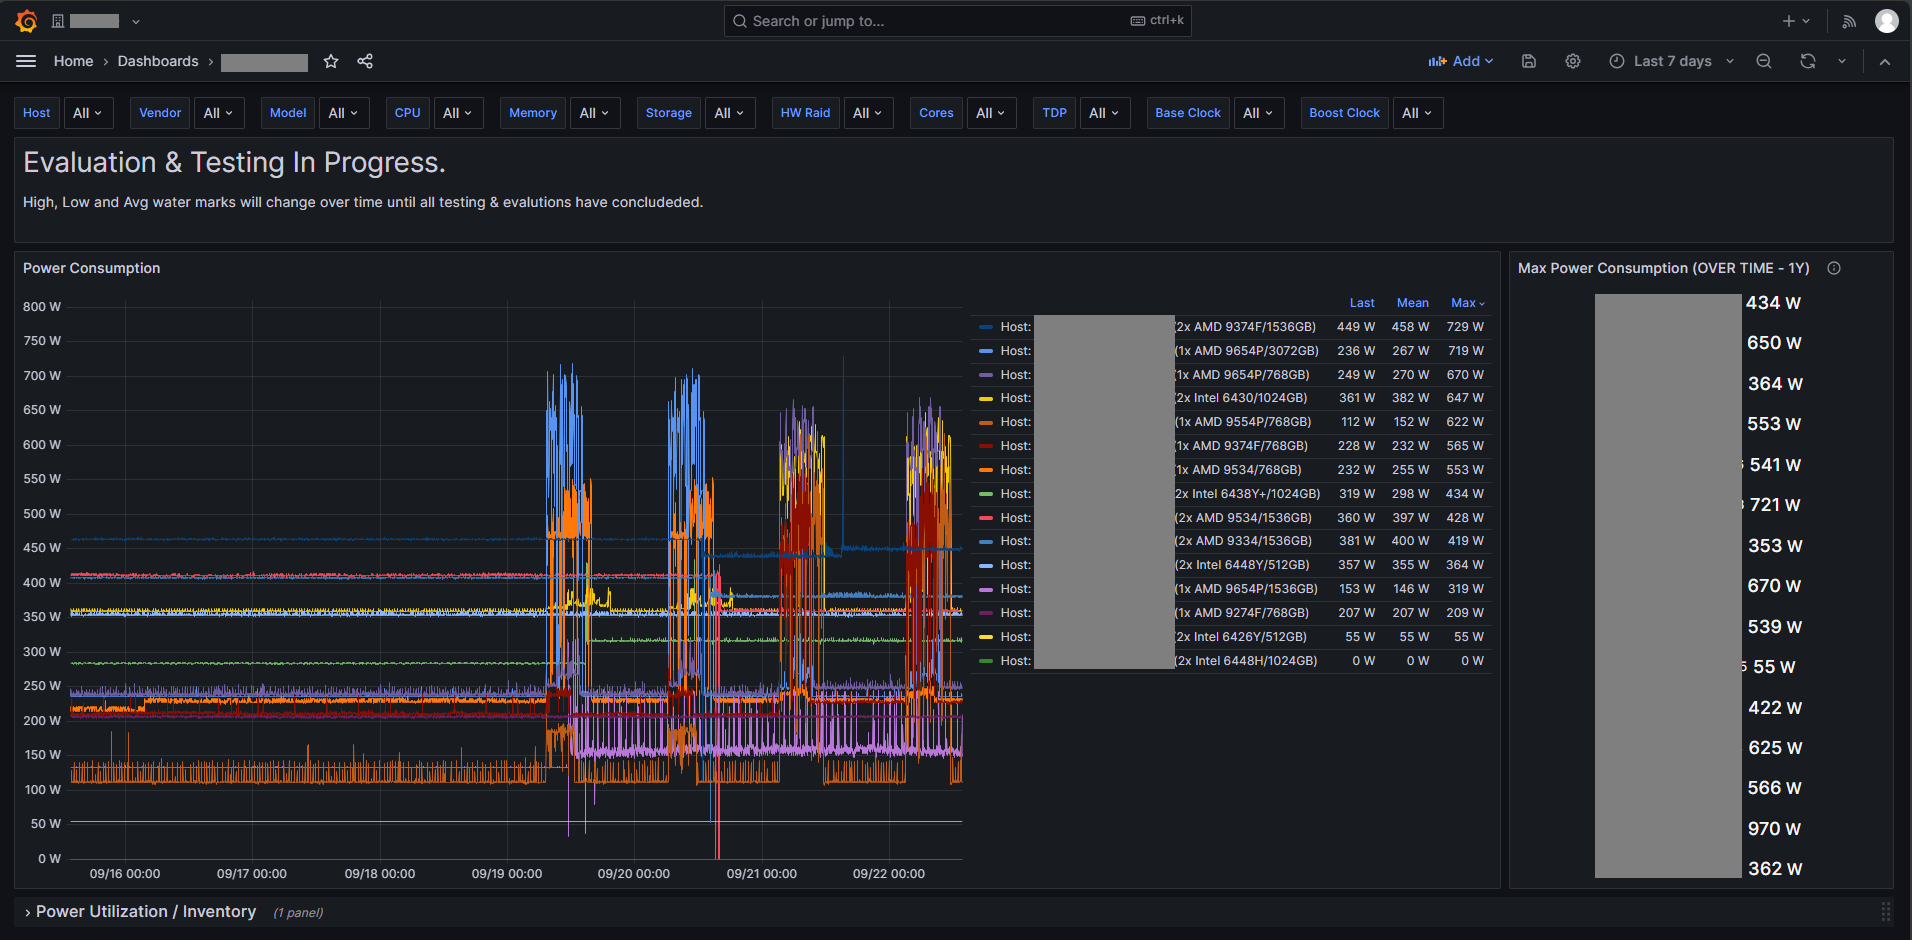
- In Grafana, I have configured the Prometheus data source and built a dashboard to visualize the data.
- Devices are then passed between teams dedicated to grid compute, general compute, virtualization and Windows / Unix where they will test their applications, evaluate performance of the system and their applications.
- Teams document their observations, tests performed and rather or not it provides value in comparison to the current systems in use.
- BIOS/UEFI settings changes, OS Imaging, application testing, and stress/performance testing is documented with timestamps and provide back and used annotate points in time in the Grafana dashboard.
- Data is provided to all stakeholders live as data is collected.